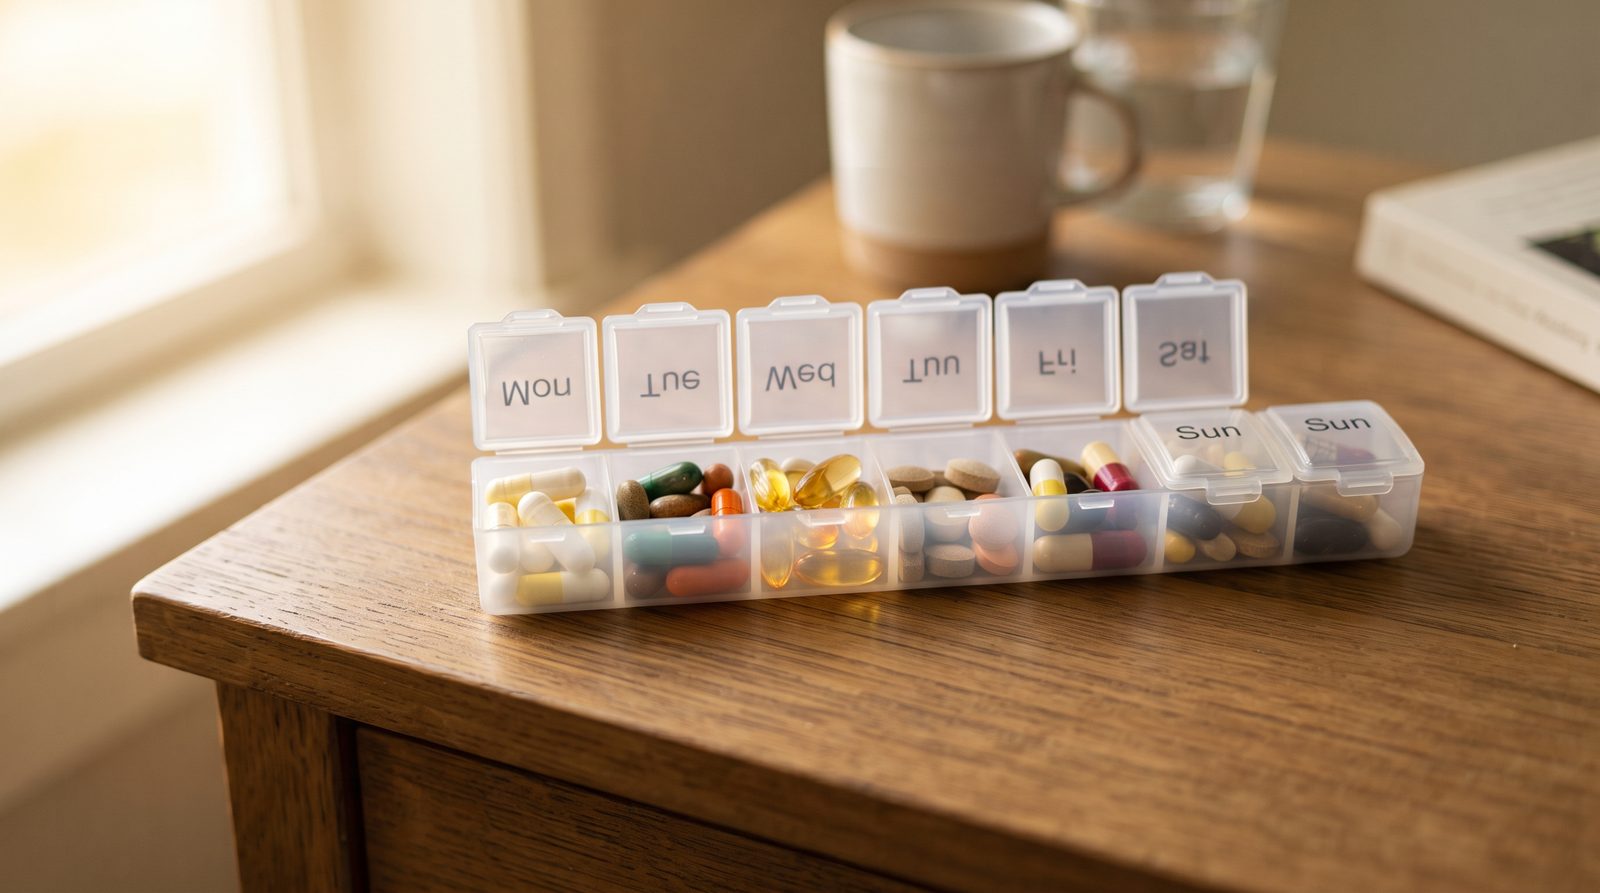
The Australian Bureau of Statistics — Australia's government statistics agency, a source we consider high-reliability given its independence from industry funding — published dietary supplement usage data in September 2025, covering the survey period January 2023 through March 2024. It offers one of the clearest age-based pictures of supplement use available from any government source we reviewed.
The overall numbers
Across the full population aged 2 and older, 33.6% reported taking a dietary supplement, with vitamin/mineral supplements specifically at 29.7%. By sex, the gap mirrors what we've found in other countries' data: 43.7% of women versus 30.8% of men.
The age curve is steep — and instructive
What stands out most in the Australian data is how sharply usage rises with age:
- Ages 18–29: 24.5%
- Ages 75 and older: 50.9%
That's roughly a doubling in usage rate from young adulthood to advanced age — a steeper curve than the roughly 30-point spread seen in comparable US CDC data, though the two surveys aren't perfectly methodologically identical, so the comparison should be read as directional rather than exact.
Why this age pattern likely holds across countries
The consistency of this age-related climb across multiple independently-run government surveys (US, Australia, and to a lesser extent South Korea) suggests it reflects something structural about aging and nutrient needs, rather than being a quirk of any one country's healthcare system or supplement marketing environment. The same biological factors discussed in our earlier look at US age data — declining nutrient absorption efficiency, rising recommended intakes for several nutrients, more frequent healthcare contact — plausibly apply universally, not just in the US.
What this means if you're tracking your own risk by life stage
If you're in an age bracket where population data consistently shows higher supplement usage, that's a signal worth taking seriously — not because you should automatically supplement to match the average, but because it reflects genuine, well-documented shifts in nutrient needs and absorption that come with aging. The specific nutrients worth checking (B12, calcium, vitamin D chief among them) are covered in detail on our nutrition guide.
Why Australia's data is worth taking seriously as a source
We want to be specific about why we're treating this figure as high-reliability: the Australian Bureau of Statistics is an independent government statistical agency, structurally separate from both the health department and any industry body, with a long track record of methodologically rigorous national surveys across many domains beyond health. This is a meaningfully different category of source than an industry trade association's consumer survey — there's no commercial incentive shaping how the questions are asked or the results are framed.
What "vitamin/mineral supplements specifically" versus "any supplement" means
The Australian data usefully separates the 33.6% overall figure from the 29.7% "vitamin/mineral supplements specifically" figure — a distinction most other countries' available data doesn't make as cleanly. The roughly 4-point gap represents people taking other supplement categories (herbal products, sports nutrition, specialty products) without necessarily taking a standard vitamin or mineral. This level of category detail is relatively rare in publicly available government data and offers a slightly more precise picture than a single blended usage number would.
Source: Australian Bureau of Statistics, "Dietary Supplements, 2023," published September 5, 2025. Survey fieldwork: January 2023–March 2024.